Mixing and Process
Flygt adaptive mixers: control against process data
Compare adaptive and fixed-speed mixing measurably, tracking process outcomes as well as energy.
Illustrative engineering scenario · Assumptions are stated in the text.
AT A GLANCE
- Compare fixed and adaptive arrangements at similar load and process targets.
- Measure energy together with deposition and process quality.
- Do not transfer a manufacturer case result as a guarantee for your site.
What can adaptation change?
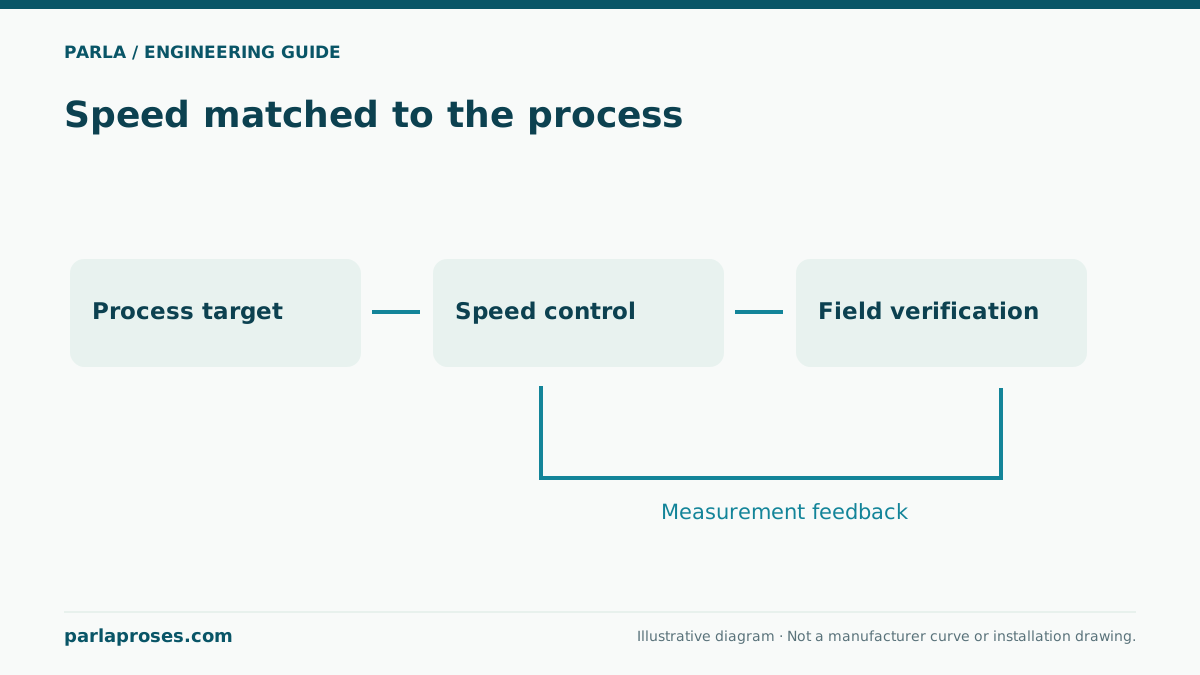
In a wastewater tank, inflow loading, level and suspended solids can change throughout a day. Fixed-speed equipment operates at a single speed; an adaptive arrangement may vary speed or operating pattern according to its control architecture. Its value depends on vessel geometry, process demand and sensor reliability. Do not derive a particular savings percentage merely from the Flygt 4320 adaptive mixer family name. Confirm the chosen variant’s motor, controls, communications and installation options in the manufacturer documents.
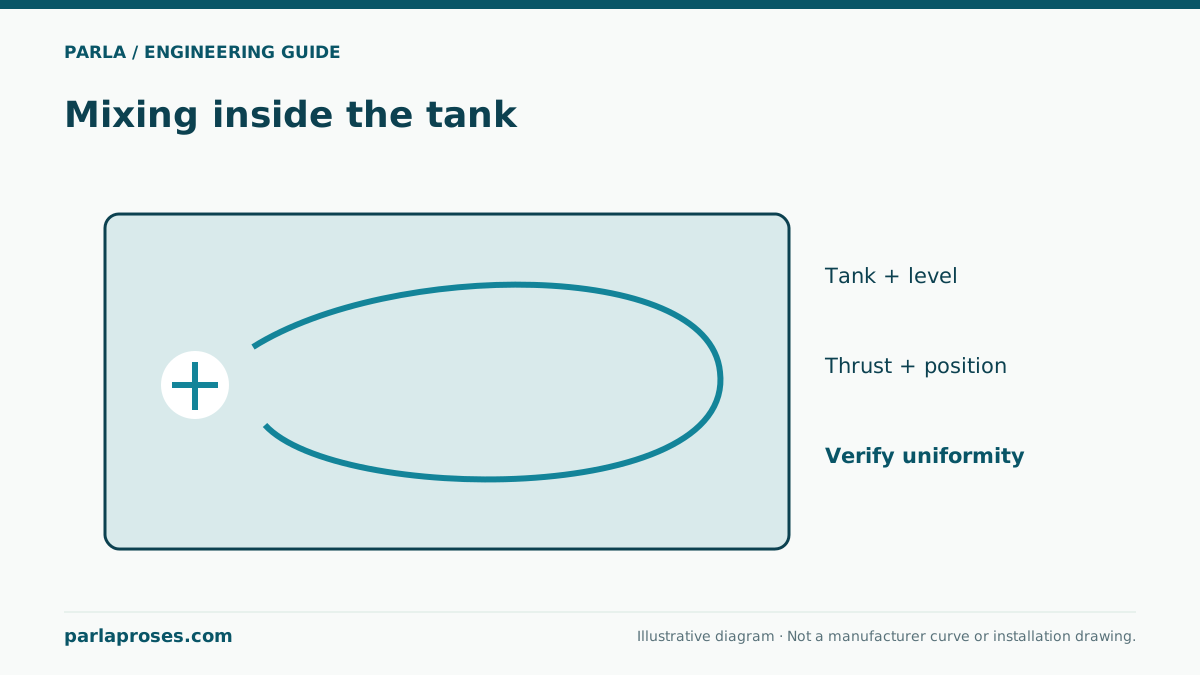
Keep the basic process objective in view: prevent bottom deposition, maintain needed homogeneity and preserve concentration limits used by the process. In an aerated vessel, define the distinct roles of aeration and mixing.
Establish a measurement plan before changing equipment
At minimum, record a dedicated electrical meter, mixer runtime, vessel level profile and observations of bottom accumulation in the existing arrangement. Where a biological process is involved, keep relevant quality measurements for comparable shifts and loads. Whole-plant kWh alone cannot isolate the mixer effect if pumps and aerators also vary. Liquid level and incoming solids load should be comparable between periods, or differences should be accounted for. Before-and-after photographs should cover the same tank locations.
Worked example: place energy beside quality
In an illustrative scenario, a fixed arrangement draws a measured average of 2.4 kW for 20 hours a day: 2.4 × 20 = 48 kWh/day. Suppose an adaptive arrangement performing comparable duty draws 1.8 kW for the same 20 hours: 36 kWh/day. The difference is 12 kWh/day, or 25% of the baseline. At 300 equivalent days per year, the arithmetic difference is 3,600 kWh. These numbers are neither guaranteed Flygt performance nor a field trial.
Compare bottom sediment, outlet concentration and process alarms in both periods. If less mixing increases deposition, the 12 kWh difference is not a technical success. Include controller consumption and differences in loading and measured average input.
| Metric | Fixed arrangement | Adaptive arrangement |
|---|---|---|
| Measured average input | 2.4 kW | 1.8 kW |
| Daily runtime | 20 hours | 20 hours |
| Daily energy | 48 kWh | 36 kWh |
| Sediment / process quality | Baseline must be measured | Compare on the same measures |
Read the manufacturer case correctly
Xylem’s New Plymouth, New Zealand case account reports 49.58% energy saving during a three-month adaptive mixer trial. This is a manufacturer-reported case, not a Parla Proses customer project. Its result belongs to specific tank and operating conditions; it cannot be compared directly with the illustrative 25% arithmetic above or transferred to another site. Treating the case percentage as a quotation guarantee would mislead. Establish the site-specific baseline, control logic, process objective and measurement period.
Document control and fault behaviour
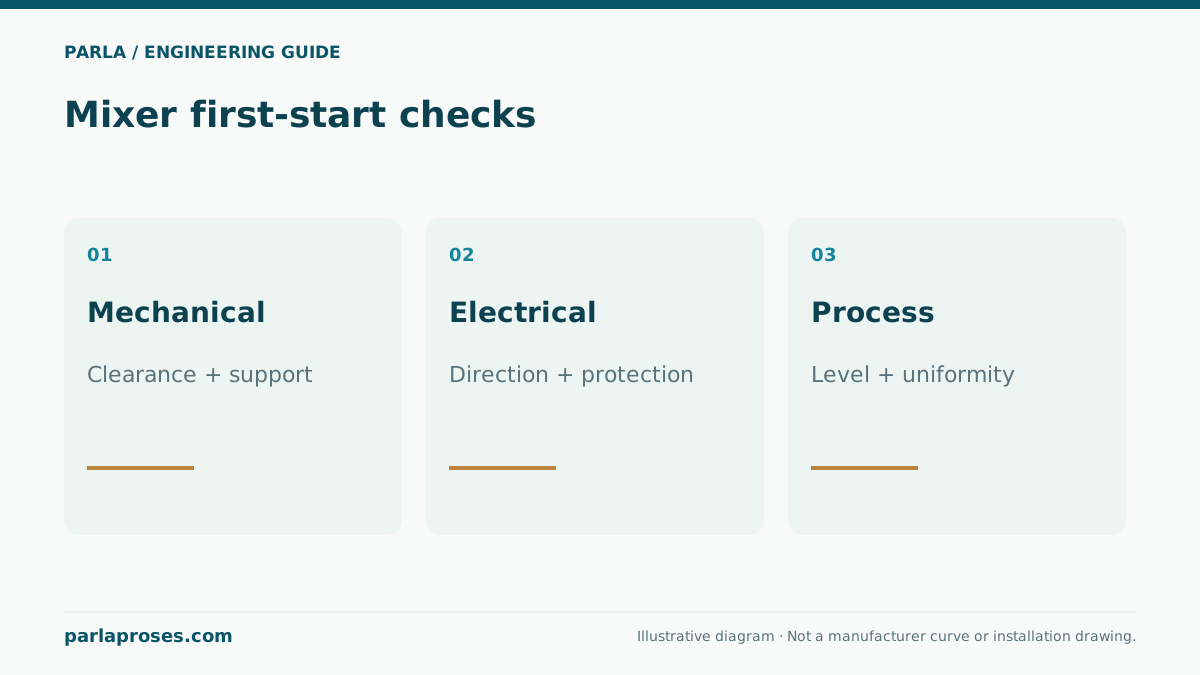
Document who may change control parameters, which fallback mode applies on sensor loss and how alarms reach operators. Check propeller submergence at low liquid level, cable movement, lifting and safe maintenance access. A single-day test cannot represent seasonal loads. Retain baseline data, interim measurements and observed process outcomes against the same timeline for later optimisation.
Frequently asked questions
Does an adaptive mixer save energy in every tank?+
No. Baseline equipment, load variability and process requirements determine the result. Measure energy and quality during comparable periods.
Does the 49.58% New Plymouth result apply to our site?+
No. It is Xylem’s reported result for a specific three-month trial, not a guaranteed result for your facility.
How is annual saving calculated from power?+
The example gives a 12 kWh daily difference and 3,600 kWh over 300 equivalent days. Actual assessment uses measured input, runtime and controller consumption.
What should happen after a sensor failure?+
Define safe fallback, alarms and operator response in the risk assessment, then test the logic of the selected controls.
Apply this assessment to your project.
Share your operating conditions, existing equipment and objective. Let’s assess product selection together with the technical documents.